Quick Answer
What is geographic farming and how does it generate listings?
Geographic farming is the practice of systematically marketing to every homeowner in a defined neighborhood (typically 300–500 homes) to establish yourself as the local real estate authority. By selecting an area with a 8–12% annual turnover rate and no single dominant agent (agent with >25% market share), and maintaining a consistent 12-month calendar of print and automated digital touchpoints, agents can build a pipeline that yields 5–8 listing contracts per year once established.
Key Takeaways
- Ideal farm turnover rate is 8–12%. Avoid neighborhoods with under 5% turnover as they lack transaction volume.
- Agents holding 20%+ local market share close seller leads at a 4× higher rate than those with under 5% share.
- Brand recognition requires 7–9 distinct exposures. Consistency of touchpoints beats intensity.
- Geographic farming compounds over time. Expect the first listing around Month 8, with growth accelerating in Year 2.
- One listing signed in a farm area generates an average of 1.3 additional local listing inquiries within 60 days.
Geographic farming is the practice of systematically marketing to every homeowner in a defined area - typically 300–500 homes - until you become the recognized real estate authority for that neighborhood. Done consistently, it generates 5–8 listings per year from a single farm at a fraction of the cost of portal leads.
The compounding effect is what makes farming powerful. Your first listing in a neighborhood triggers recognition. "Isn't that the agent who sold [nearby address]?" becomes the most common reason sellers call. By month 18, agents who farm correctly often have a 20–30% market share in their area - earning them a permanent first-call advantage over any new entrant. According to CoreLogic's 2025 Agent Market Share Report, agents with 20%+ neighborhood market share close at a 4× higher rate when contacted by local sellers than agents with under 5% share.
"Geographic farming isn't a lead generation tactic. It's a market ownership strategy. The goal isn't to get calls - it's to become the obvious choice before the call is made."
This guide covers the complete farming system: choosing the right area, the 12-month touchpoint calendar, the AI tools that automate the content delivery, and the compounding math that makes farming the highest-ROI listing strategy available to a solo agent. For other seller lead strategies that pair with farming, see: how to get seller leads in real estate - the 2026 complete guide.
How to Select the Right Farm Area: The 5-Criteria Framework
The biggest mistake agents make in geographic farming is choosing a neighborhood they like rather than one the data supports. Farm selection is a data exercise. The five criteria below, applied in order, filter out poor farm candidates and surface areas where consistent effort will generate maximum return.
Use your MLS's statistical tools, CoreLogic's market analytics, or Realtor.com's neighborhood data to evaluate each criterion before committing.
| Criterion | Ideal Range | Why It Matters | Red Flag |
|---|---|---|---|
| Annual turnover rate | 8–12% of homes | Determines how many listings are available per year | <5% = too slow |
| Your current market share | <10% of local sales | Low share = room to grow. Avoid dominant areas. | >20% already? Expand instead |
| Dominant competitor? | No agent >25% share | Avoid areas owned by a dominant agent | Single agent >30%: walk away |
| Home price range | Match your brand | Commission must justify the monthly farming budget | Price too low = negative ROI |
| Community cohesion | HOA preferred | Higher neighbor awareness and word-of-mouth | HOA = faster authority |
Farm Size vs Monthly Budget
Expected Annual Listings (Year 1)
The 12-Month Farming Calendar: Every Touchpoint, Month-by-Month
Consistency beats intensity in geographic farming. An agent who sends one mailer every month for 12 months outperforms an agent who sends 6 mailers in 3 months and stops. Homeowners need 7–9 exposures to an agent's brand before they develop brand recognition - consistency creates that accumulation.
Annual Market Outlook Report
Year-in-review for the neighborhood: total homes sold, avg. days on market, price trends. Positions you as the data authority on day one of the calendar year.
Just Sold / Just Listed Postcard
Headline: "I just sold [Address] for $X in [Y] days - curious what your home is worth?" Include a QR code linking to your home valuation page.
Spring Market Introduction (20% of homes)
Knock on 80–100 doors. Bring a printed spring market update. Script: "I'm [Name], your neighborhood's specialist - wanted to drop off this update personally."
Q1 Neighborhood Sold Report
Every home that sold in Q1: address, sale price, days on market, list-to-sale ratio. Shows your market knowledge without saying a word about yourself.
Just Sold Postcard + Valuation CTA
Second just-sold mailer. By now, homeowners have seen your name twice. The third exposure (this one) begins building true recognition.
Summer Local Events Neighborhood Guide
Best local restaurants, summer events, parks, farmer's markets. Non-real estate content. Builds community association without a sales pitch.
Mid-Year Market Update
H1 performance: how the neighborhood is trending vs last year. Clear, visual, data-led. Homeowners begin describing you as the neighborhood expert.
Back-to-School Neighborhood Guide
School ratings, bus routes, local tutoring. Hyper-relevant for families. Shows you understand their lives, not just their home values.
Q3 Sold Report + Fall Prep Checklist
Combine the quarterly sold report with a 10-point fall home maintenance checklist. Practical value + market data yields high retention.
Client Appreciation Event (Open to Farm)
Pumpkin patch, wine tasting, or fall event. Invite past clients and open to farm residents. Creates face-to-face relationship that mailers can't replicate.
Thanksgiving Gratitude Card
Personal, warm, no market data. "Grateful to serve this community" - signed by you. By November, your name is recognized. This card feels personal because it is.
Year-End Market Report + Holiday Card
Full-year recap: total sold, price appreciation, market outlook. The data-heavy companion to the November card. Ends the year on an authoritative note.
How Market Share Compounds: The 18-Month Farming Growth Curve
Geographic farming follows a compounding curve, not a linear one. The first 6 months generate little visible return - this is the brand recognition phase. Months 7–12 typically produce the first 1–2 listings as recognition converts to trust. By year 2, a consistent farmer typically has 15–25% neighborhood market share and listings arrive with no cold outreach required.
Estimated Market Share Over 18 Months
Source: CoreLogic Agent Market Share Report 2025 · Pinova platform farming agent data · NAR Neighborhood Marketing Study
The Listing Multiplier Effect
Every listing you take in a farm area generates free marketing to every other homeowner in the neighborhood. Your yard sign, your sold postcard, your "I just sold [nearby address]" mailer - each one is visible proof of your competence. One listing in a farm typically generates 1.3 additional inquiries from the same neighborhood within 60 days.
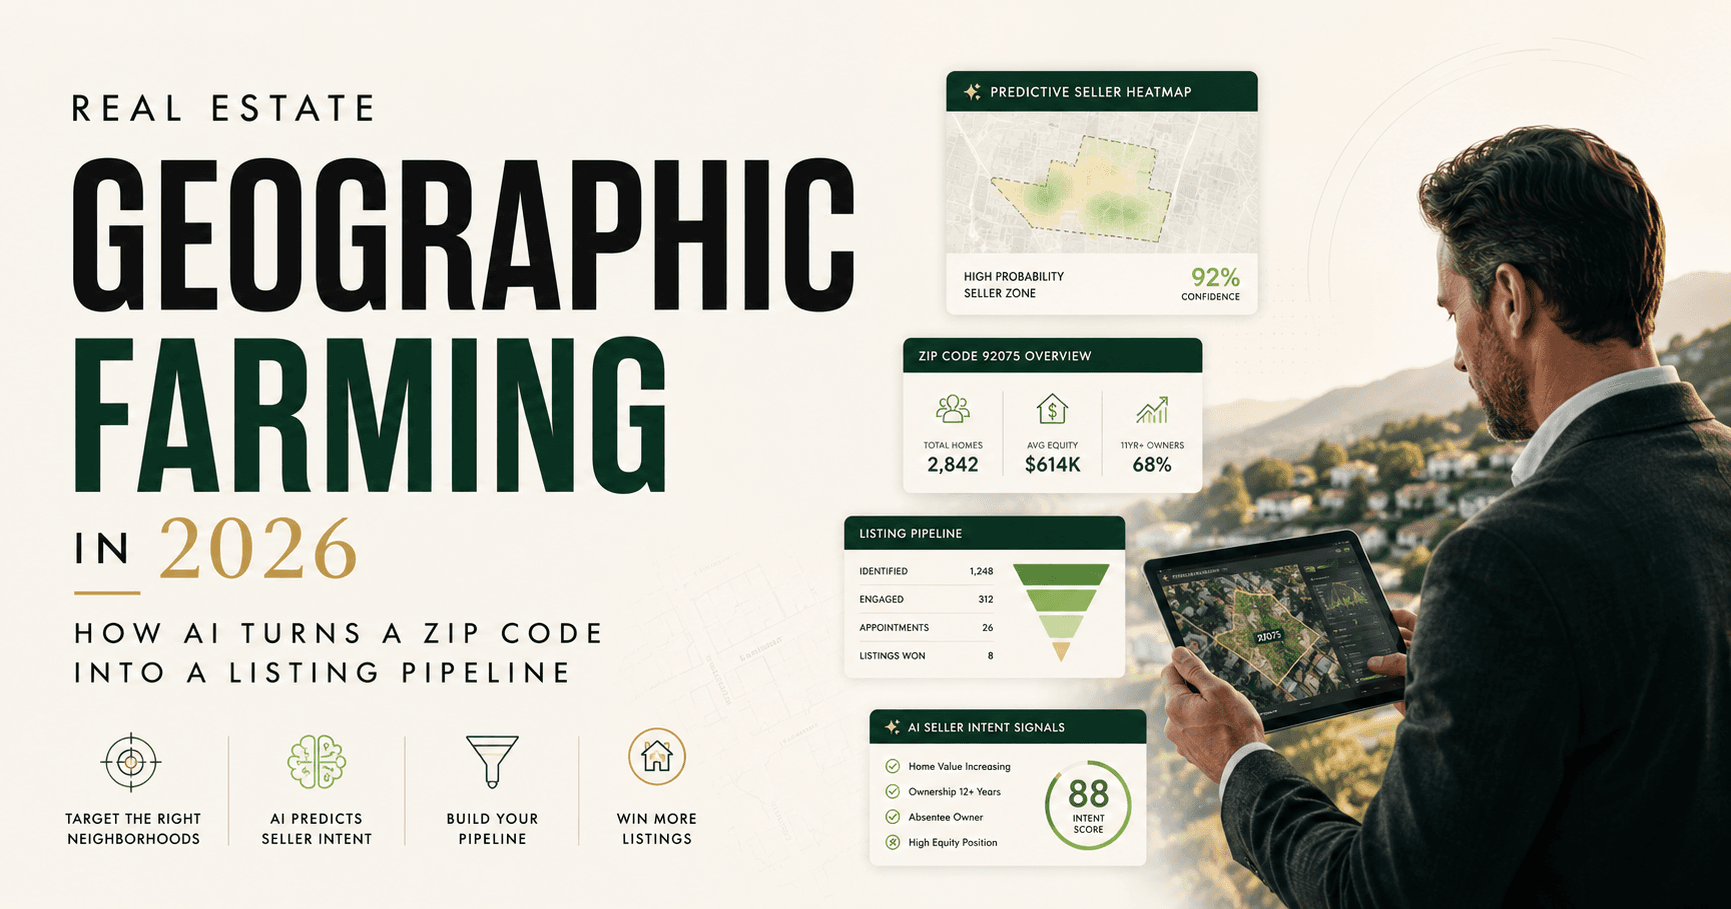
How AI Automates the Digital Side of Your Farm
The print side of farming requires physical mailer design and postage. The digital side - email market reports, valuation follow-up, and equity updates for homeowners who register online - can be fully automated.
Monthly Neighborhood Market Reports
Pinova auto-generates a branded neighborhood market report for your farm area every month - new solds, price trends, days on market - and sends it automatically to every registered farm contact.
Just-Sold Alert Emails
When any home sells in your farm zip code, Pinova triggers an automated just-sold email to your list: "[Address] just sold for $X - here's what it means for your home's value."
Valuation Lead Capture + Nurture
Every homeowner who visits your farm area valuation page and submits their address enters an automated 18-month nurture sequence. Monthly equity updates, comparable sale alerts, seasonal check-ins.
Intent Signal Detection
When a farm area contact opens 3+ emails in a week, revisits the valuation page, or clicks "book a call," Pinova sends you an immediate alert with their contact info and a suggested script.
Geographic Farming Success Stories
James R. Built 22% Market Share in 420-Home HOA Community
James selected a 420-home HOA subdivision with 9.2% annual turnover and no dominant agent (highest competitor had 12% share). He committed to monthly market reports - mailed and emailed - plus quarterly door knocking. By month 8 he had his first 2 farm listings. By month 18 he held 22% neighborhood market share and 7 listings from the farm that year - at a total monthly budget of $520.
22% market share · 7 listings/year · $520/mo budgetYvonne P. Generates 4 Listing Appointments Per Month From Farm Contacts
Yvonne farms a 600-home area using a hybrid print + digital approach. Her Pinova IDX site captures valuation leads from the neighborhood - she has 214 registered farm contacts receiving monthly automated equity reports. The automated just-sold alert emails generate 2–3 replies per sale, and her intent signal alerts prompt personal calls to 4–6 contacts per month. Monthly listing appointment rate from farm: 4. Budget: $650/month. Commission generated: $42,000+/quarter.
214 digital farm contacts · 4 listing appts/month · $42k+/quarter commissionGeographic Farming ROI: The 3-Year Math
At 6 listings per year from a $600/month farm ($7,200 annual budget), commission earned = $57,000. Net after farming cost = $49,800 - a 6.9× annual return. By year 3, with 22%+ market share, most agents scale the same farm to 8–10 listings per year. The investment is front-loaded; the returns compound. See also: home valuation landing pages and referral marketing for real estate agents - both strategies that pair naturally with a geographic farm.
Ready to put this into practice?
Pinova gives you the website, AI, CRM, and follow-up in one platform - live in 48 hours, no credit card required.
Book a Free Strategy Call
📚 Related Reading
- How to Get Seller Leads in Real Estate: The 2026 Playbook for Listing Agents
- How to Win More Listing Appointments: The Pre-Listing System Top Agents Use in 2026
- Home Valuation Landing Pages: How Agents Turn "What's My Home Worth?" Into Listing Appointments
- How to Set Up a 90-Day Lead Nurture Sequence from Scratch